4 | Characterising and Graphing Wave Motion
4 | Characterising and Graphing Wave Motion
Characterising Waves
- There are several quantitative ways of describing the oscillations of waves.
Frequency (f)
- Frequency is defined as the number of wave cycles per second.
- A wave cycle involves:
- Oscillation from a central starting position to a maximum in one direction (peak).
- Oscillation from the peak to a maximum in the opposite direction (trough)*.
- Oscillation from the trough back to the starting position.
- * For transverse and longitudinal waves, this will involve passing back through the central starting position.
- Wave frequency is measured in in hertz (Hz), where 1 Hz = 1 cycle per second.
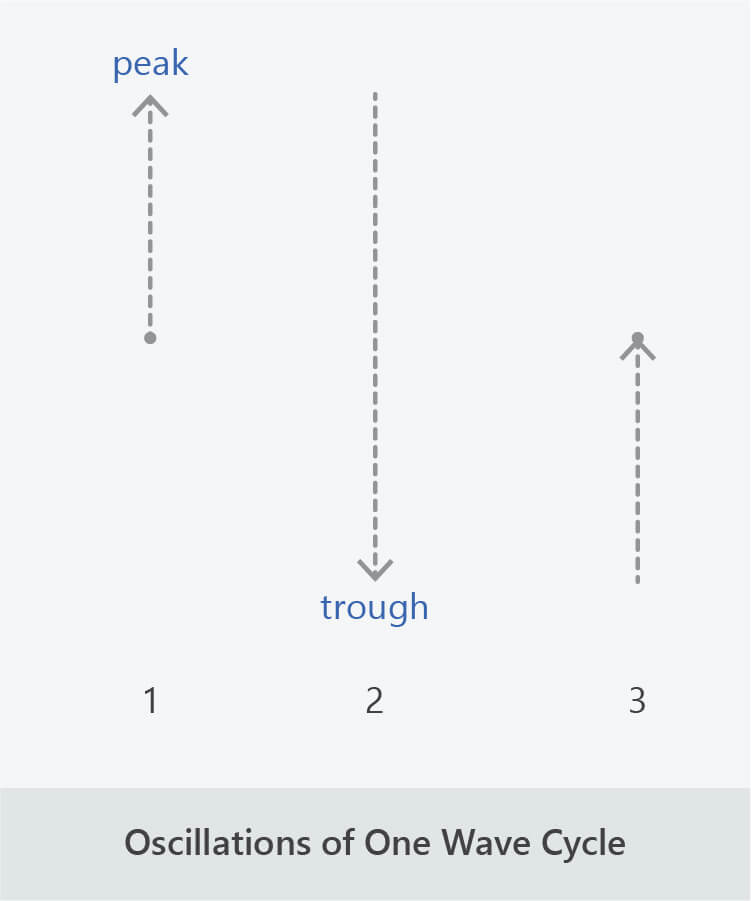
Wave motion involves oscillations about a point.
Amplitude
- Amplitude is defined as the distance between the central starting position and the maximum point of oscillation (peak or trough).
Velocity (v)
- Velocity is defined as how fast the wave travels through space.
- The velocity of both mechanical and electromagnetic waves depends on the medium they are travelling through.
- Example 1
- Sound waves travel through air at 340 m/s and through water at 1,500 m/s.
- Example 2
- Light waves travel through air at 300,000 km/s and through water at 225,000 km/s.
Wavelength (λ)
- Wavelength is defined as the distance a wave travels during one cycle.
Graphing Wave Motion
- Waves can be represented graphically, as waveforms, as shown below.
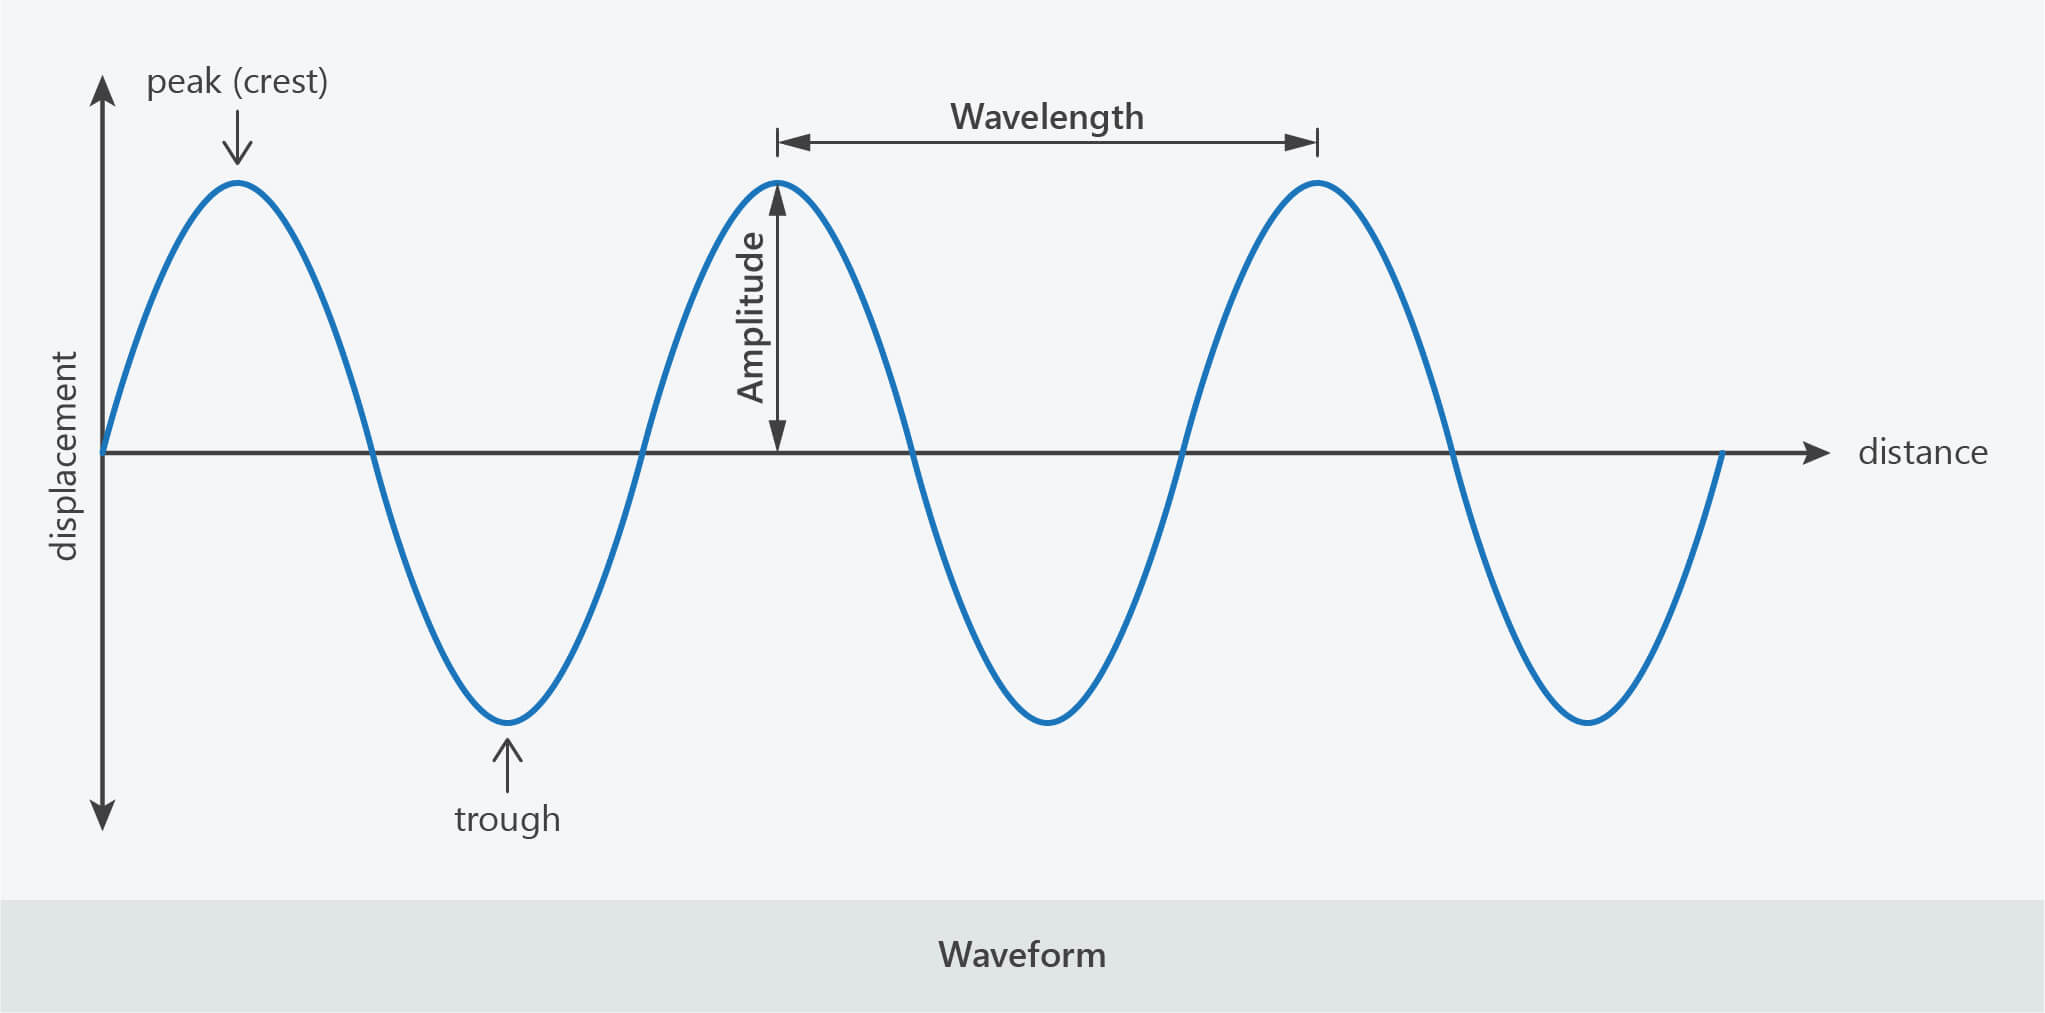
Waveforms are graphical representations of wave motion.
- Amplitude is shown as the distance from the x-axis to a peak (or trough).
- Wavelength is shown as the distance between two peaks (or troughs).
- Frequency and velocity are not shown.
- Note, waveforms are representations of waves, they are not diagrams of wave motion and should not be confused with transverse waves. Waveforms of transverse waves and longitudinal waves have the same appearance.